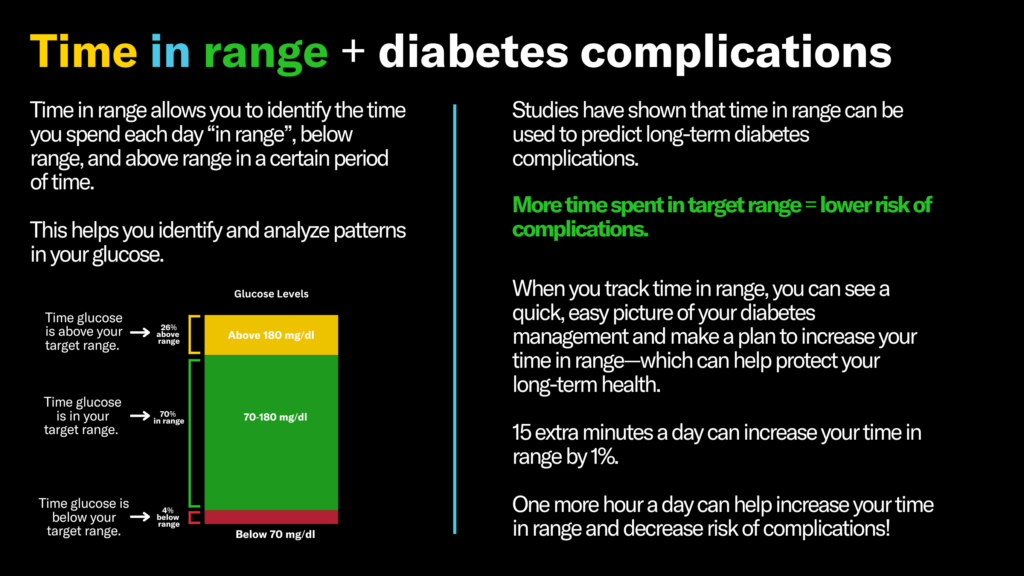
Did you know using time in range can help decrease your risk of diabetes complications? These include things like:
diabetes-related retinopathy (eye disease)
diabetes-related nephropathy (kidney disease)
diabetes-related neuropathy (nerve damage—this is often why people with diabetes lose their feet or legs)
How can time in range help decrease the risk of these complications?

Studies have shown a connection between increased time in range and decreased risk of diabetes complications. That means when you increase your time in range, you decrease your risk of diabetes-related eye disease, kidney disease, and nerve damage.
Time in range is able to do this because it shows you the entire picture of your day-to-day management. Time in range is the percentage of time that a person spends with their blood glucose levels in a target range. When we refer to time in range, we also mean the metrics that are measured alongside it—like time below range (TBR) and time above range (TAR).
Using time in range to manage your diabetes can help you recognize patterns and learn what works best for your body and your life — like how your glucose responds to changes in your food, exercise, sleep, hormones, and so much more. Which can give you actionable steps to start decreasing your risk for diabetes complications.
The big question: Is time in range as good as A1C in predicting diabetes complications?
The short answer: yes!
Global experts have been researching how time in range compares to A1C when it comes to predicting complications and have found that it’s an excellent alternative. In fact, in one study, they found that every 5% decrease in time in range was associated with a 22% increase in odds of eye disease.
The problem with A1C and diabetes complications
While A1C can also predict diabetes complications, it can sometimes be misleading. It’s an average of your glucose numbers over 3 months, which means it can’t capture the highs and lows. The graphic below shows 3 different people who all have a 7% A1C (what is considered the goal for most people), but have significantly different experiences with their glucose levels.

If you and your healthcare team are only looking at your A1C, you might be missing highs and lows that can contribute to an increased risk of developing diabetes complications.
Using CGM metrics like time in range allows you to identify the peaks and valleys of life with diabetes—and make specific changes to make your path a little flatter, help you feel better, and enable you to live the healthiest, happiest life possible.

